|
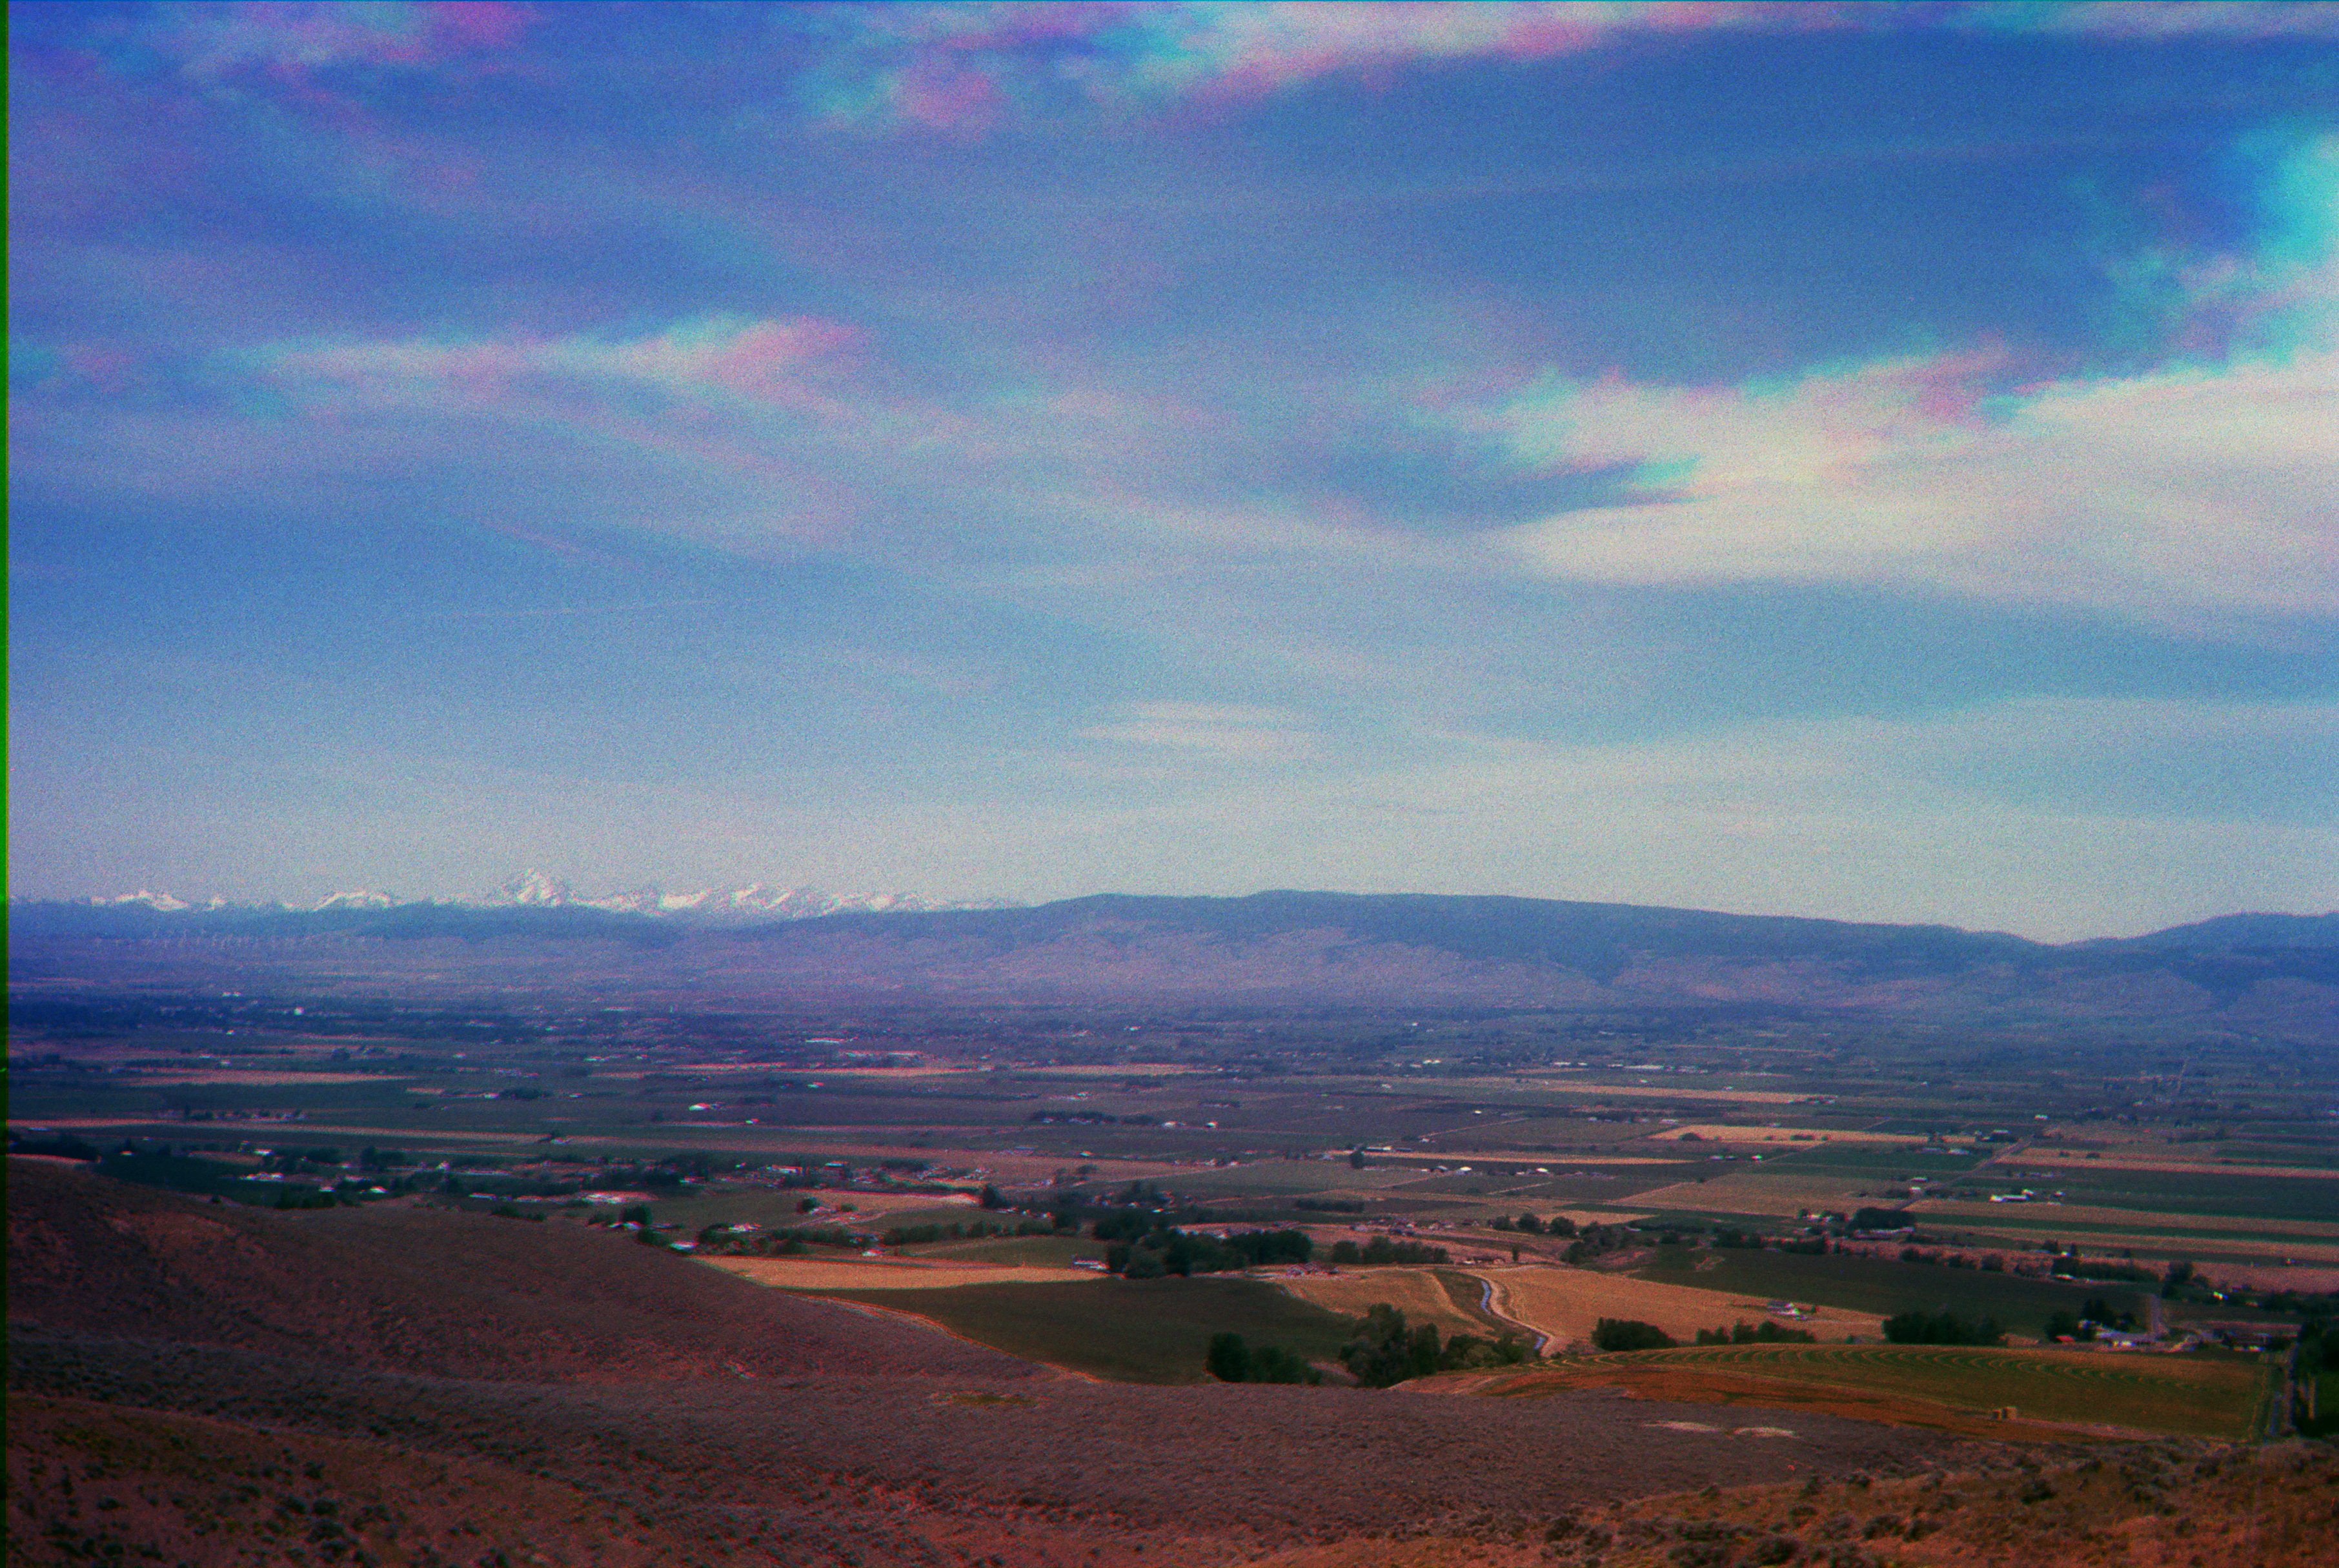
This is a color picture; you can tell the sky is blue, the vegetation is
green and so on. If you look closely, however, you'll see the clouds
have colored fringes. That's because I made this picture the hard
way: taking black-and-white images through colored filters, scanning
the results and combining them in software. The clouds moved slightly
while I was in the process, so the blue, green and red frames don't
quite register. So eventually, with much trouble, I was able to do
what your smartphone does in 1/100 second. But this was more than
a simple demonstration. |
|
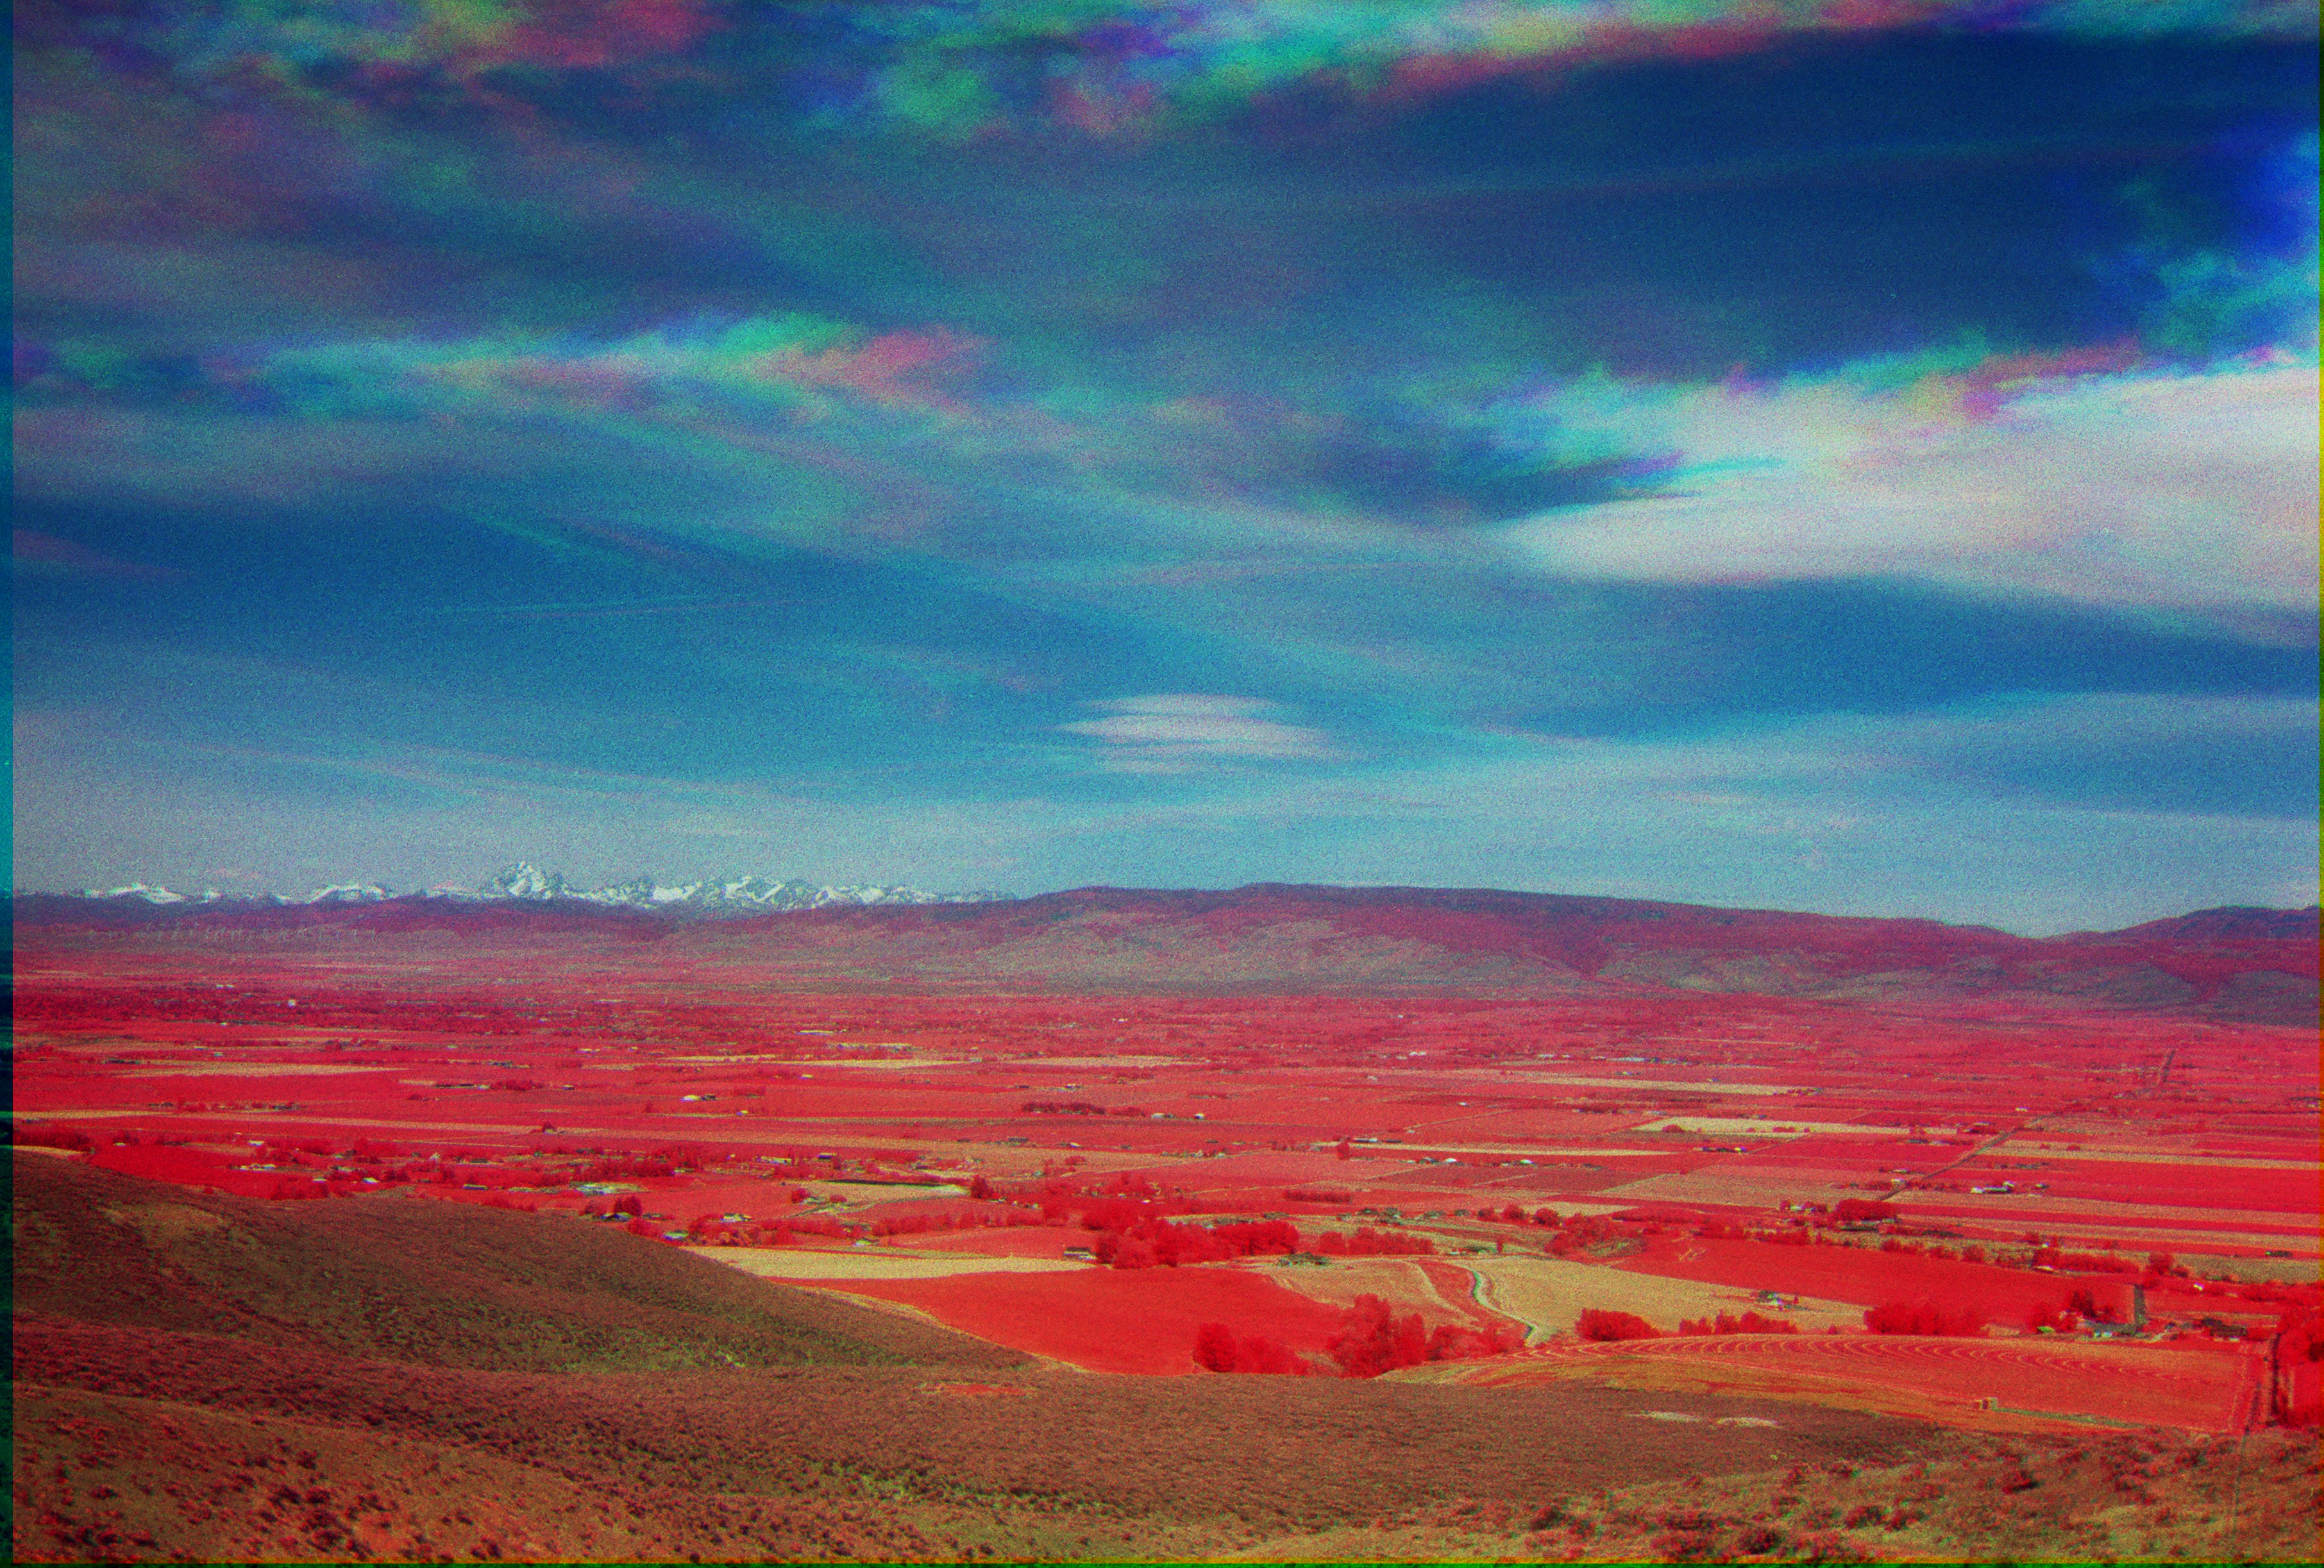
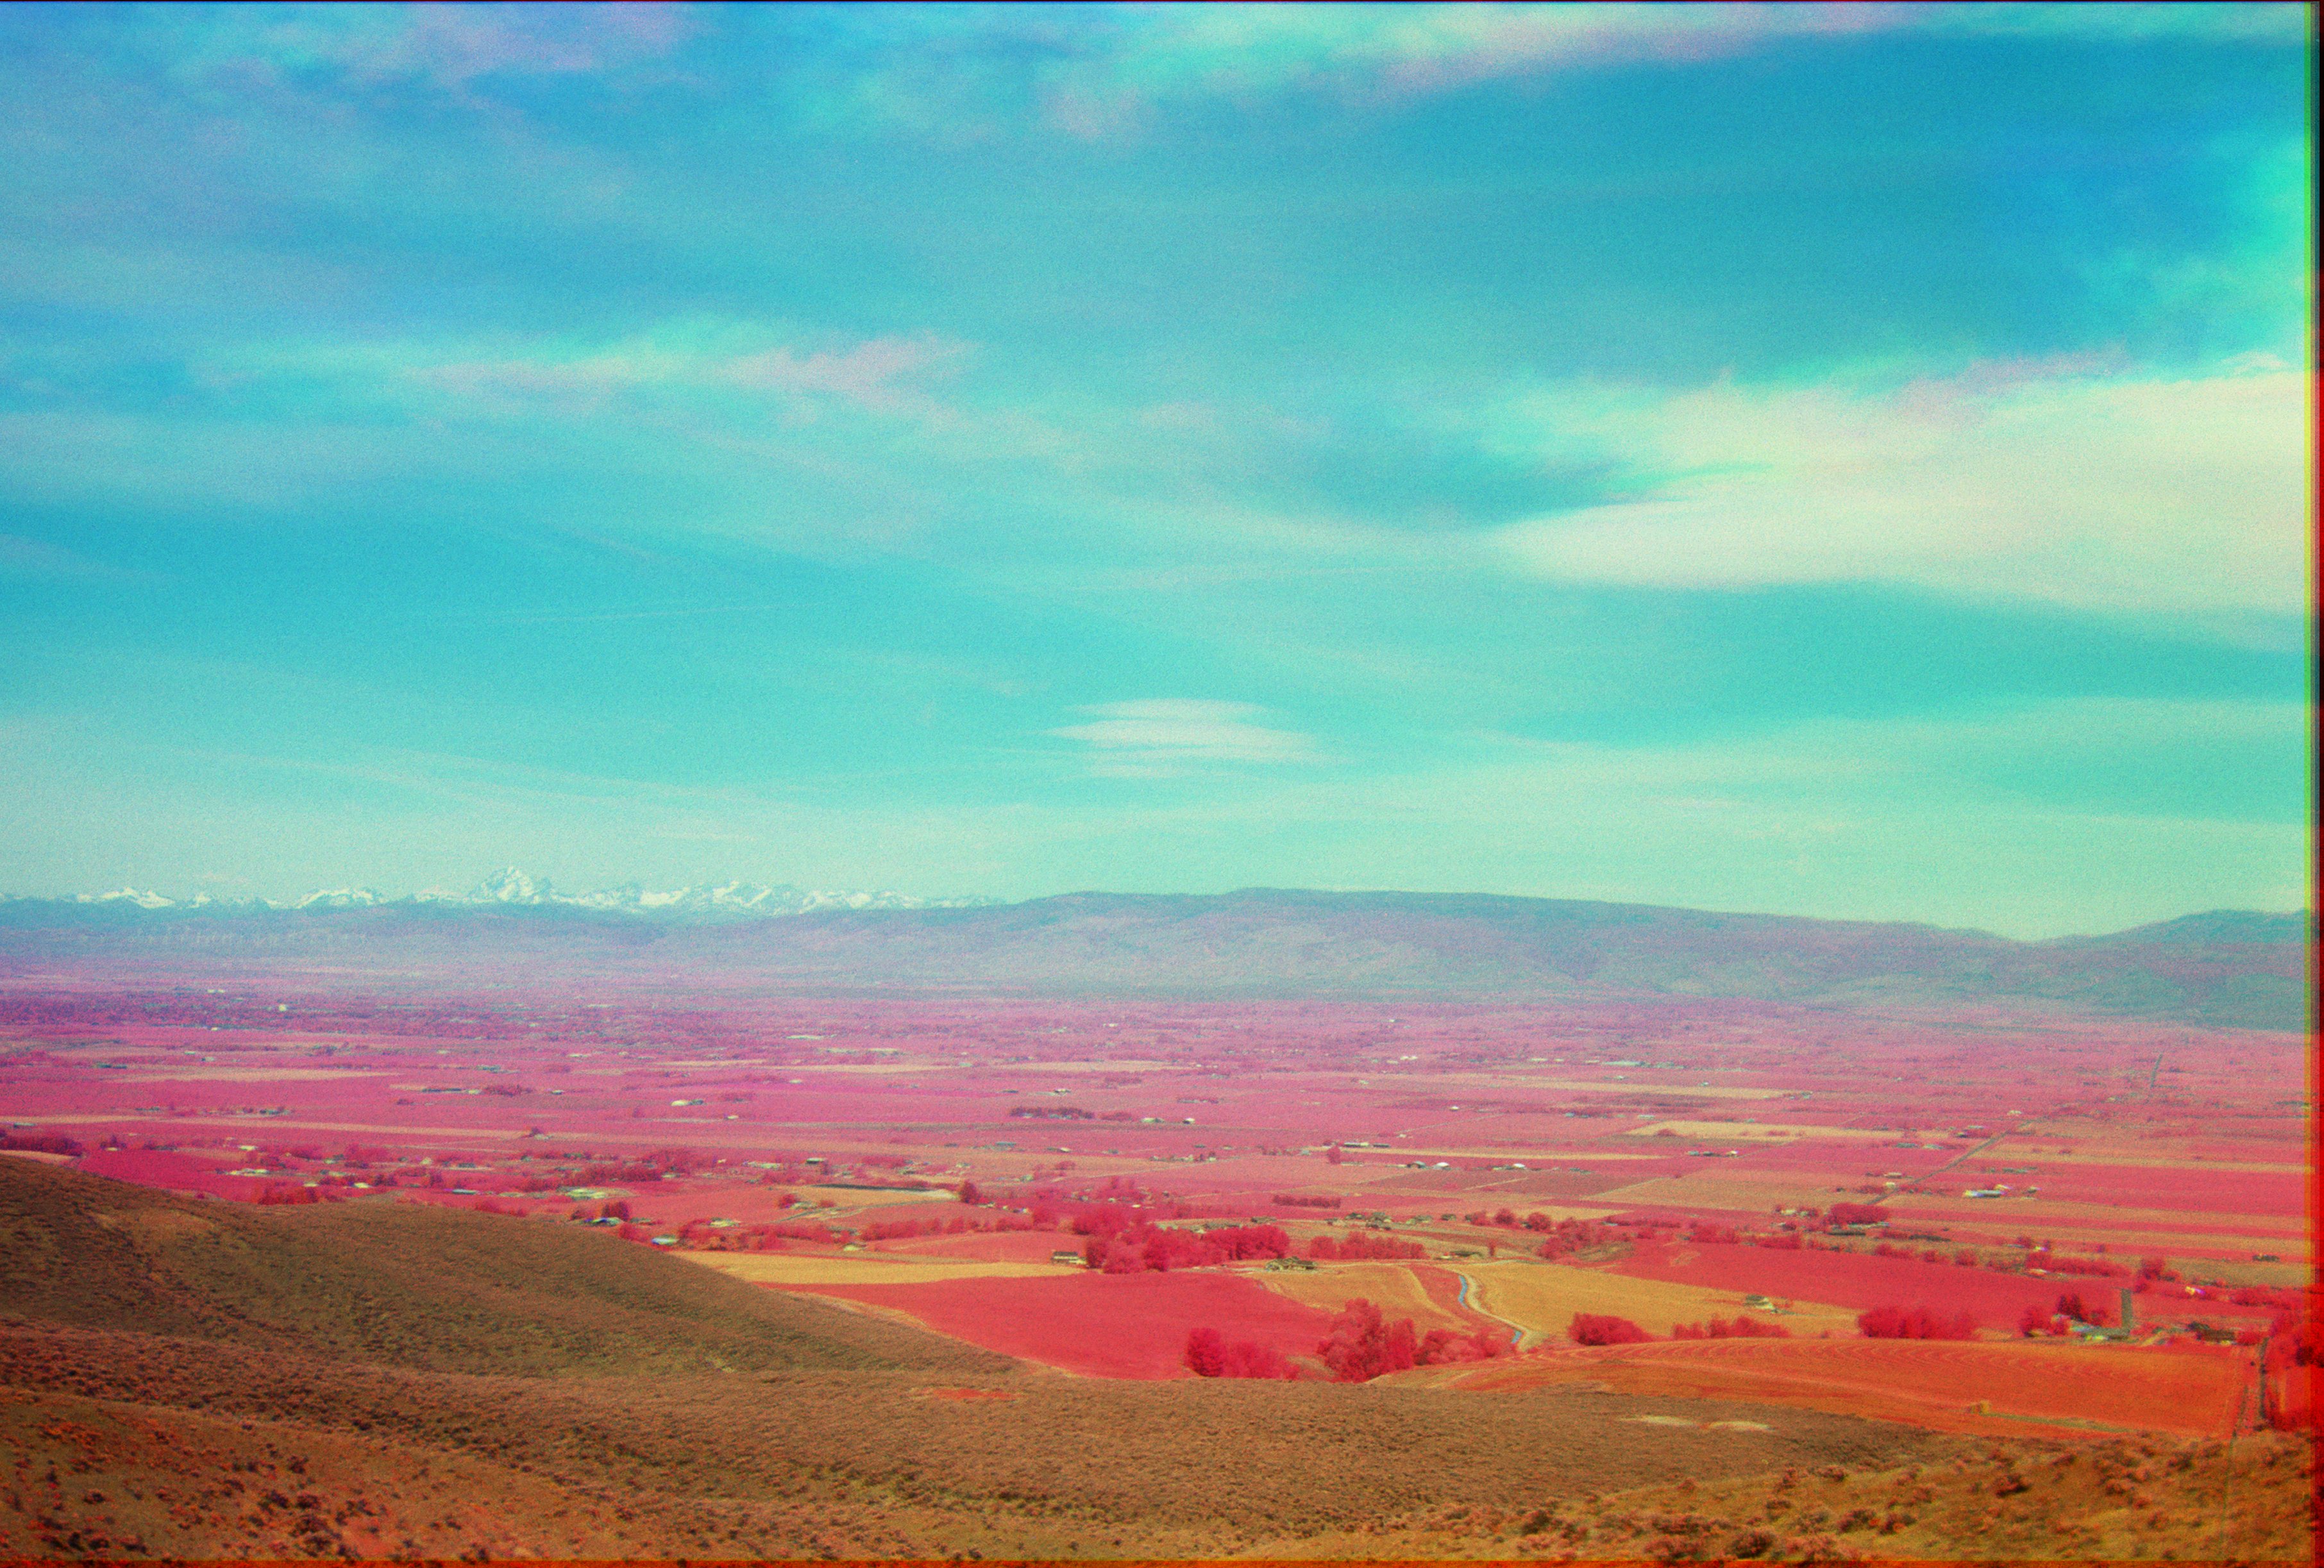
I also took pictures through an infrared filter (this was done on Kodak
infrared film, which is no longer made, alas). Now I mapped the green
image to the blue channel, red to green, infrared to red; so it's what
you'd see if your eyes were shifted down a color in sensitivity. The
sky gets darker, it's easier to see into the distance, and living
vegetation turns bright red (I think it's cholorphyll that reflects so
well in the near infrared). Kodak used to make a color film that did
just this (also long gone, alas). Satellites in orbit often use their
electronic detectors to track vegetation by making `false-color' maps
in this way.
|
|
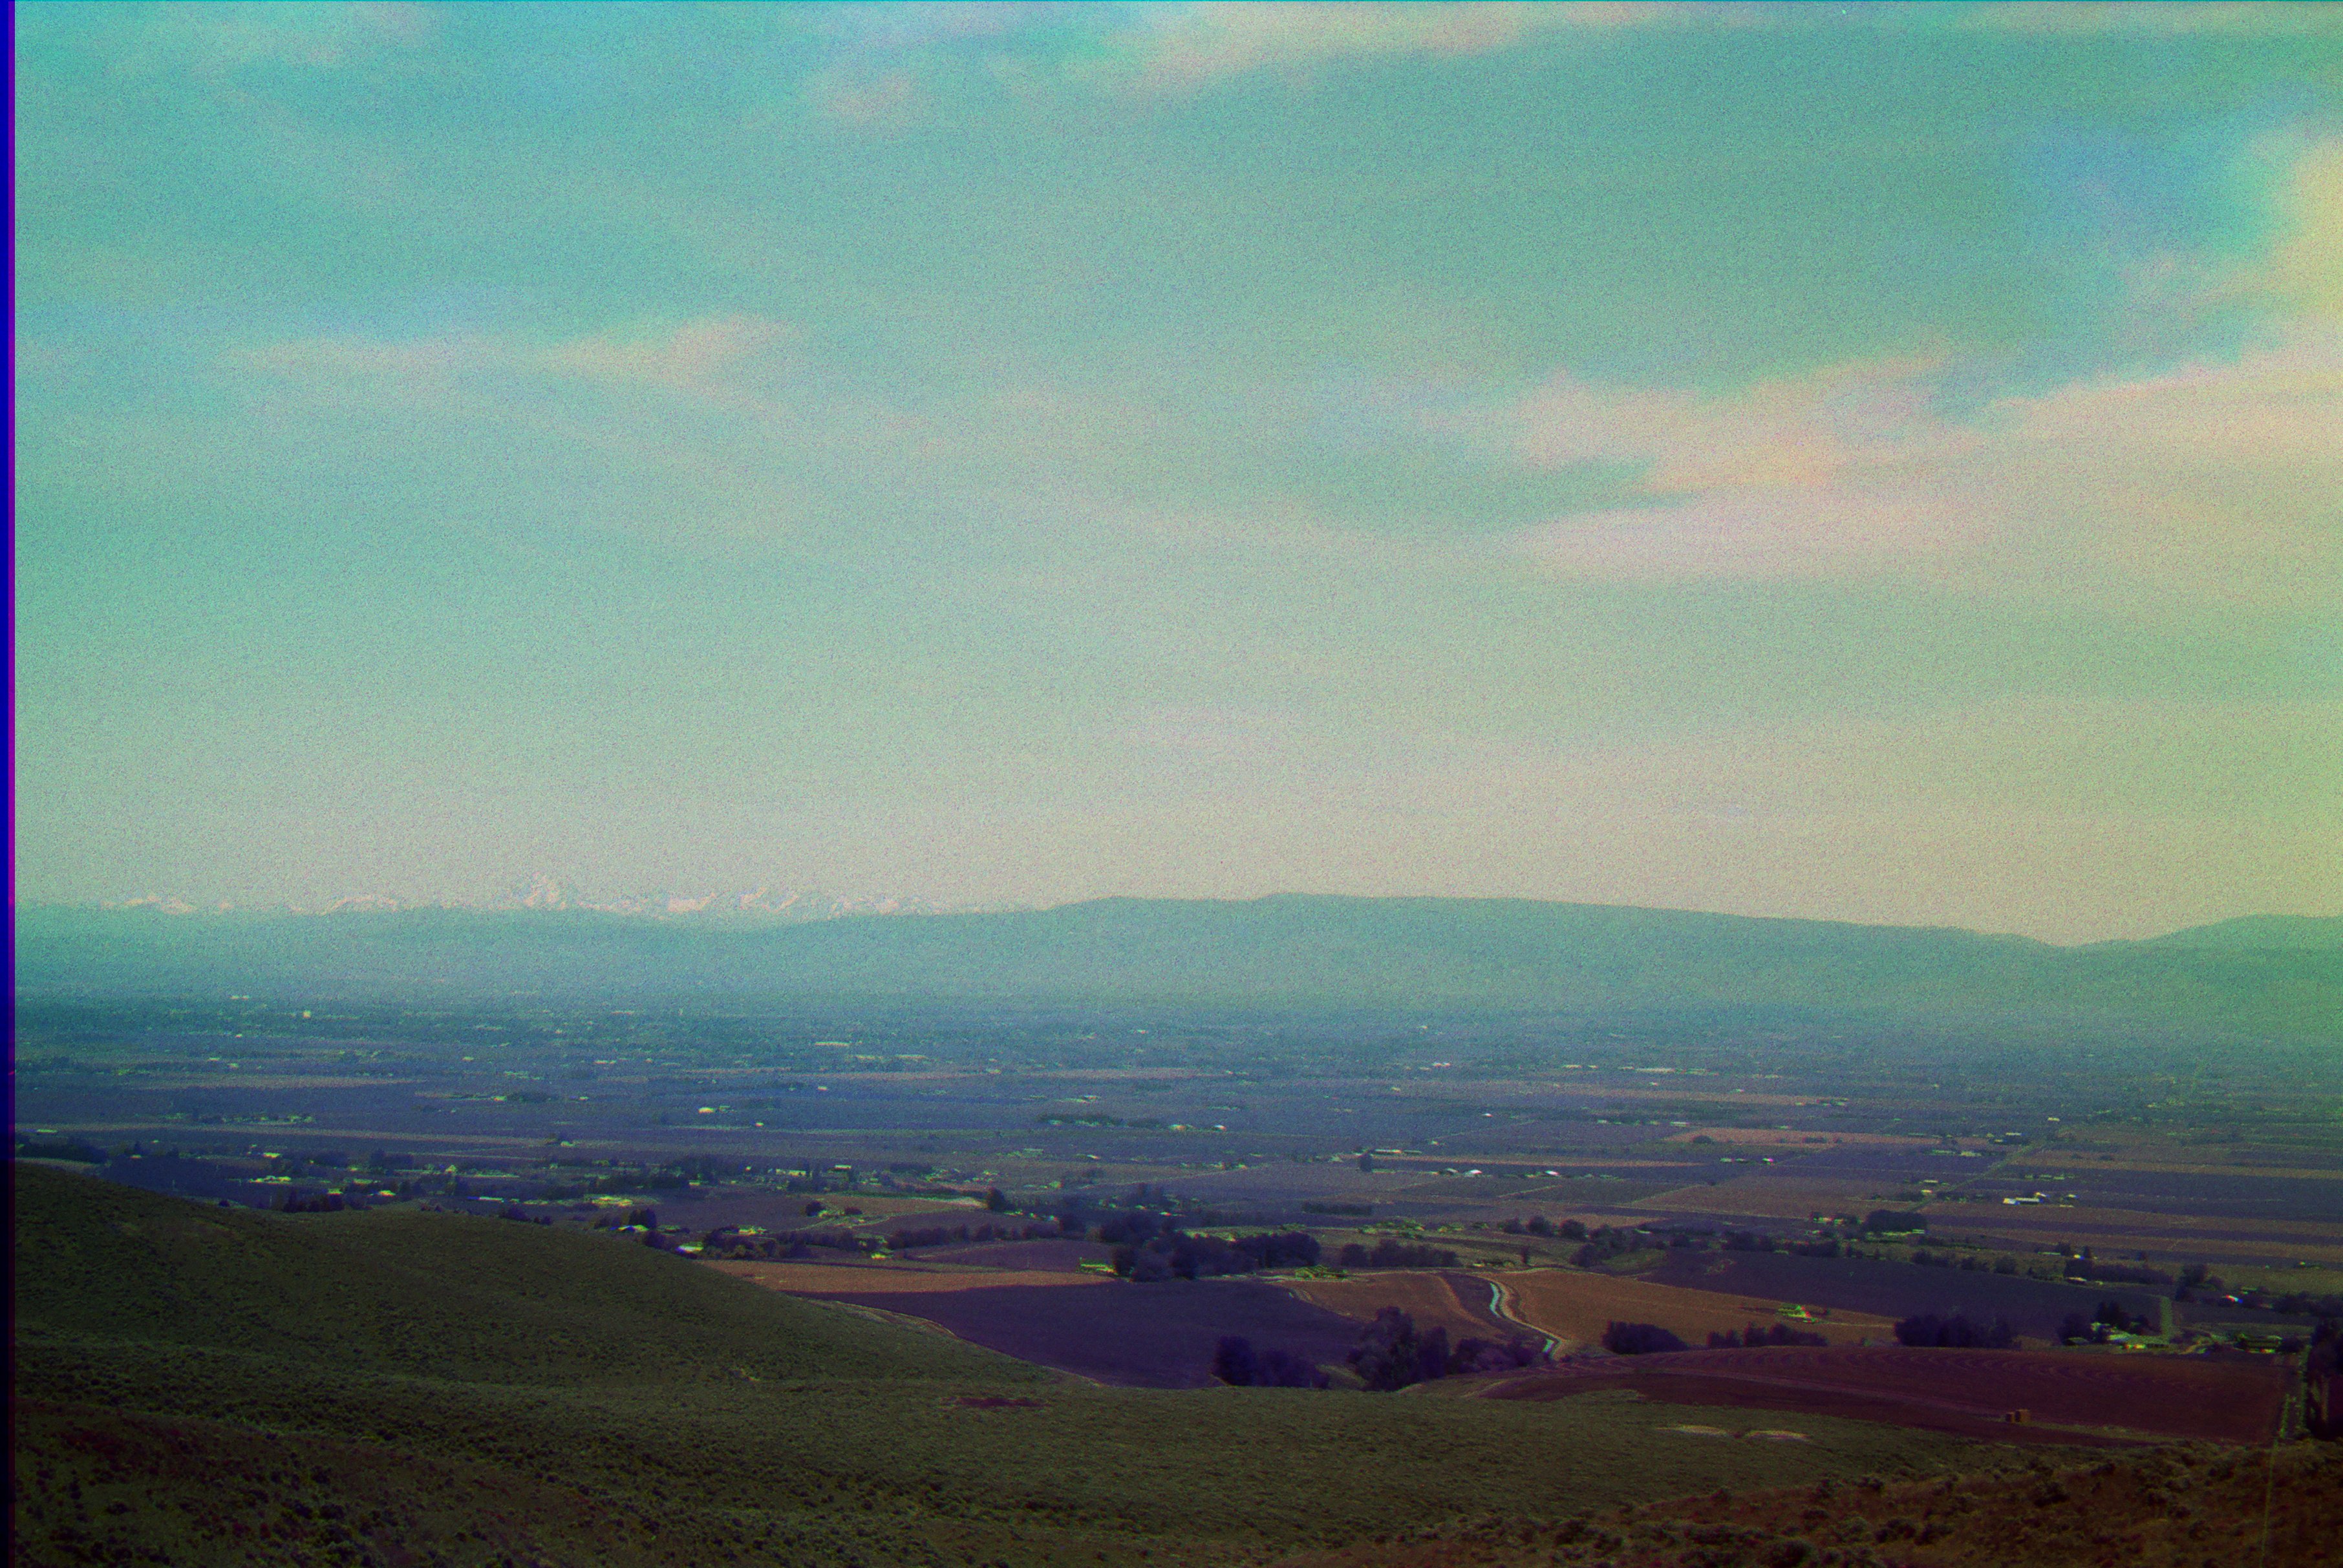
I also took a frame in the ultraviolet. This shows what you'd see if your
eyes were shifted up a color in sensitivity: UV mapped to blue,
blue to green, green to red. It's not as spectacular as the previous
picture, which probably accounts for the fact you don't see this done,
and Kodak (as far as I know) never made a film to do this. Since UV gets
absorbed in the air easily, you don't see as far; the mountains and the
far range of hills are less distinct. (If you're interested in haze,
though, this might be just what you need.) Note the difference in color
between the semi-desert plants in the foreground and the crops in the
valley.
|
|
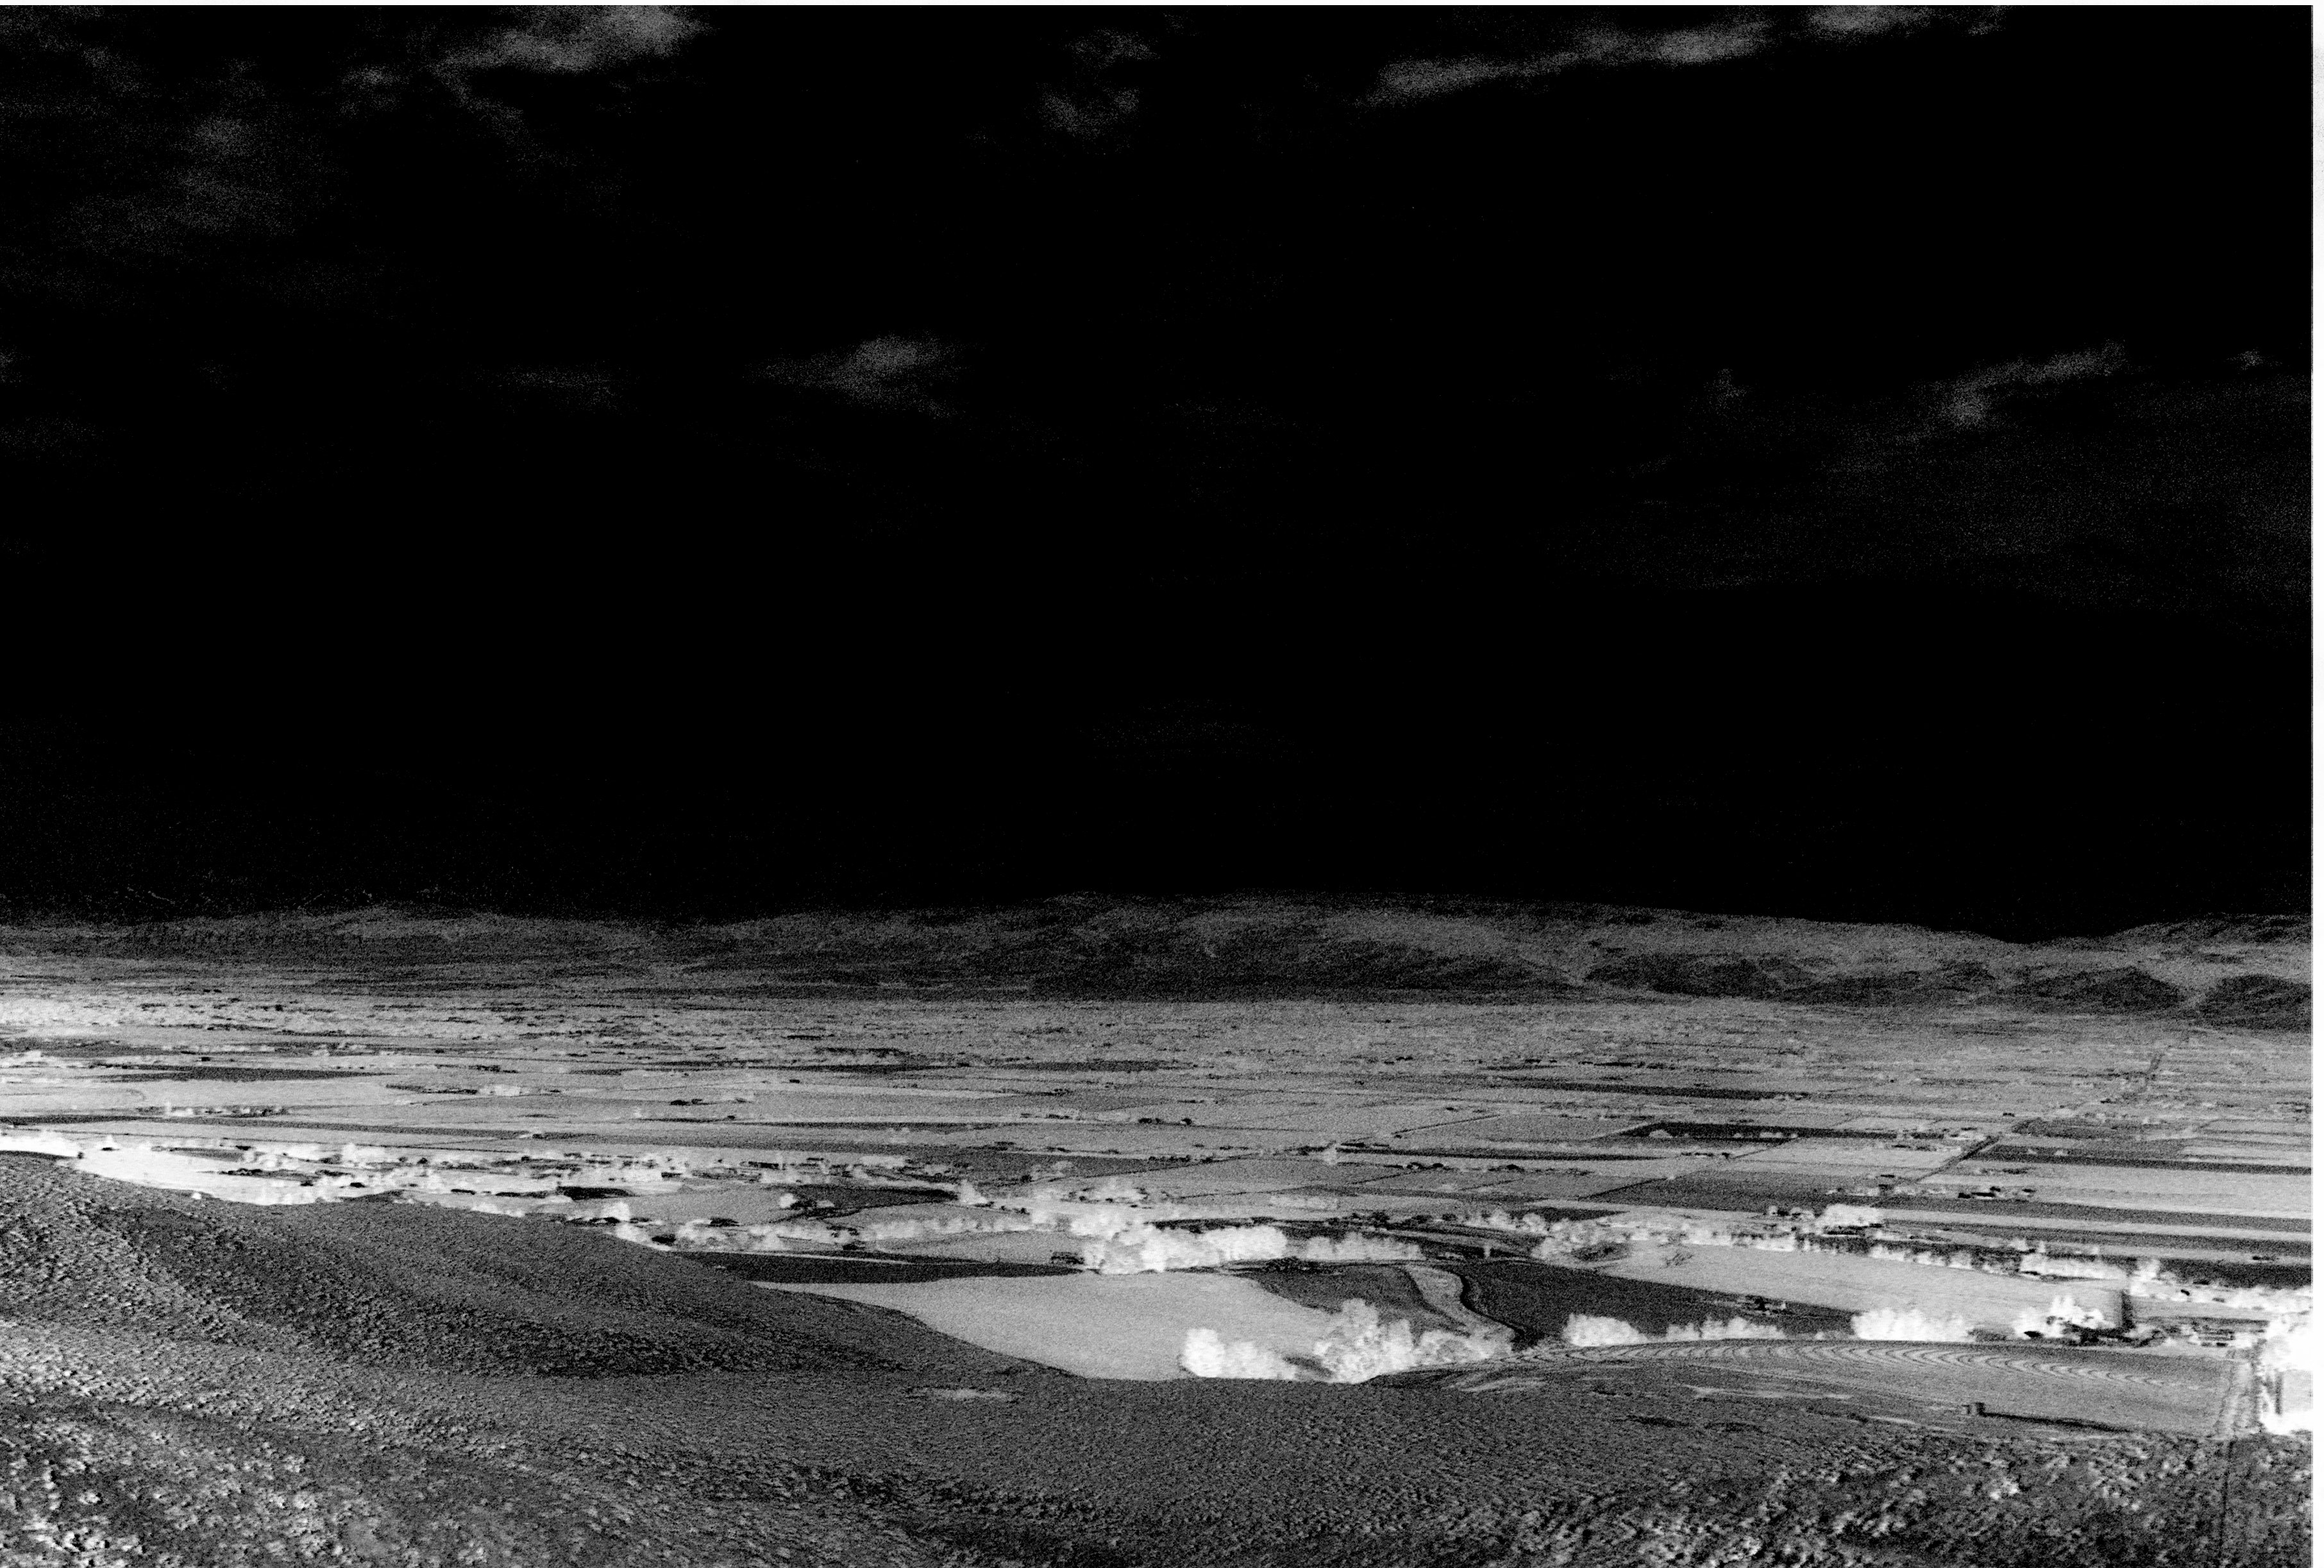
Here is what you get by running a mathematical operation with the red
and infrared: (IR - R)/(IR + R). If these were properly calibrated
images, this would be the Normalized Difference Vegetation Index
(NDVI). It's a good measure of the quantity of growing plants, and
is a common product of satellite imaging. Here there are some artifacts
from moving clouds; also, since some of the vegetation in this image is
seen through far more atmosphere than other parts, NDVI is not as good
as a quantitative measure in this situation.
|
|
Finally, I put all five colors together. UV is mapped to blue; blue
to a middle blue-green; green to green; red to a middle red-green; IR to
red. This is something like what you'd see if your eyes were sensitive
to the invisible colors on either side of the visible spectrum. In
principle, there's much more information in this picture than in the first
one. I invite you to examine this and see what you can find. (I think
I know why the sky is turquoise instead of blue. . .)
|
More three- and five-color synthesized pictures can be found in these