In astronomy (as in any experimental science) you can go to a great deal of time and trouble to gather all sorts of data. At that point you may find, if the situation is at all complicated, that it's not clear how to look at it. How do you display five-dimensional data so it makes sense, especially if you don't know beforehand what kind of sense it should make?
You can plot things two dimensions at a time, as I did when first looking at The Kinematic State of the Local Volume. But that can use up a lot of paper quickly, and if in the end you don't find anything (as happened to me), there remains the sneaking suspicion that it's just because I didn't plot the right things against each other. I think the display I put together more recently, from which these views are taken, is much more useful.
I went through the literature (which means many, many papers written by other people) for galaxies within ten megaparsecs (abbreviated 10 Mpc) of the Milky Way, whose distances and radial velocities were known very well, say within 10 percent and a few kilometers per second respectively. Now, ten million parsecs, over thirty million light-years, may sound like a great distance. . . well, it is. A long way to walk, certainly, and only the very brightest stars can be seen by the largest telescopes that far away. But as galaxies go that's a small neighborhood, amounting to a few small groups and no galaxy clusters. It's negligible on cosmological scales. But within this distance the data are reasonably complete and of very high quality, so we can do things very accurately.
I found 149 galaxies with good data here. But, to be more complete, I had to add another 21 galaxies whose distances were not known so well, but which were known to be bright (and therefore probably important). This gives me 170 galaxies, all of the brighter ones in the 10 Mpc sphere (the Local Volume). There are probably twice as many more, but they're all very small, and contribute very little to the luminosity of the region.
Next I found the best-fit uniform expansion for all these galaxies. The most important motion of everything in the Local Volume is, indeed, a general expansion, amounting to something like 65.5 kilometers per second per megaparsec (a mixture of units that only an astronomer could love). Having found that, I subtract it from the data, giving the deviations of the galaxies from uniform expansion; since we only know the velocities in the radial direction, these are the radial peculiar velocities. Finally, I figured the luminosity of each galaxy, the intrinsic brightness; this means taking the measured brightness and correcting for the fact that some are close and some are far away.
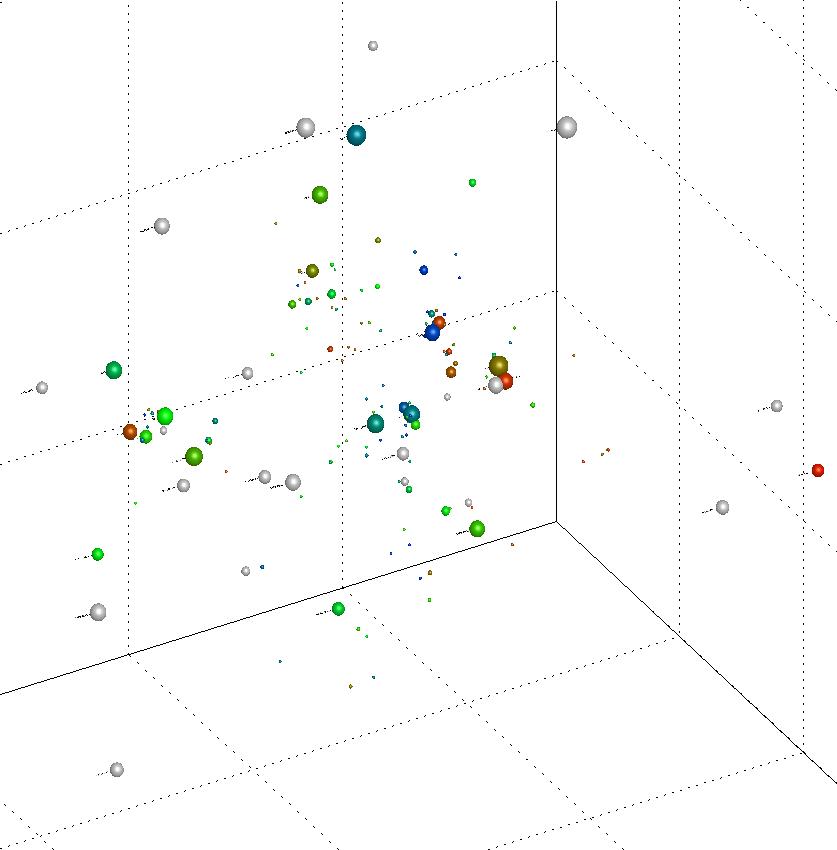
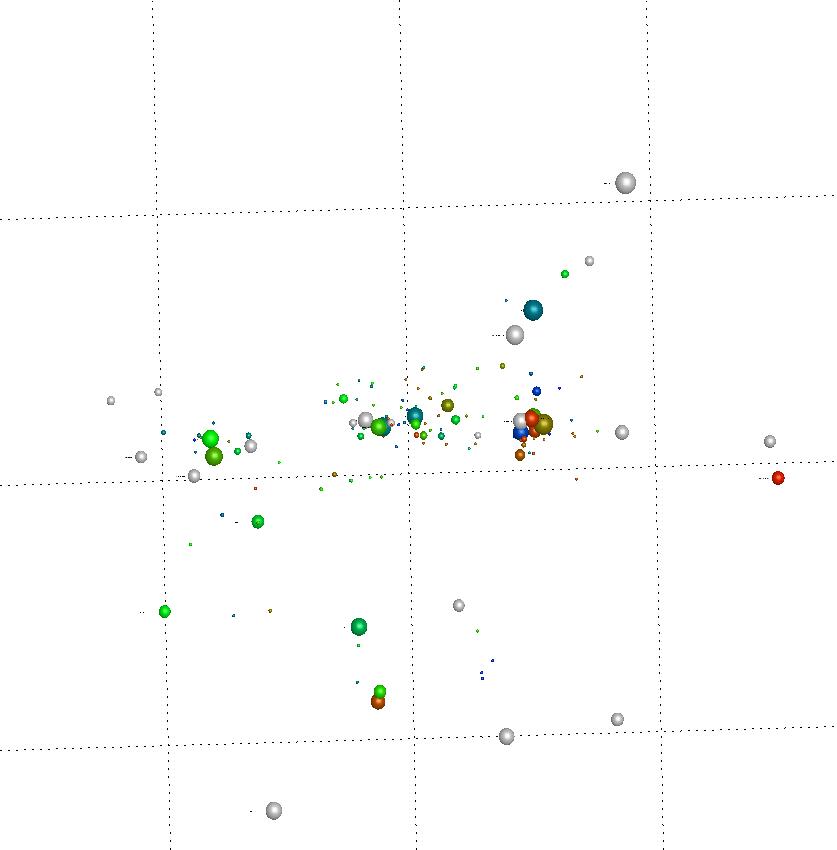
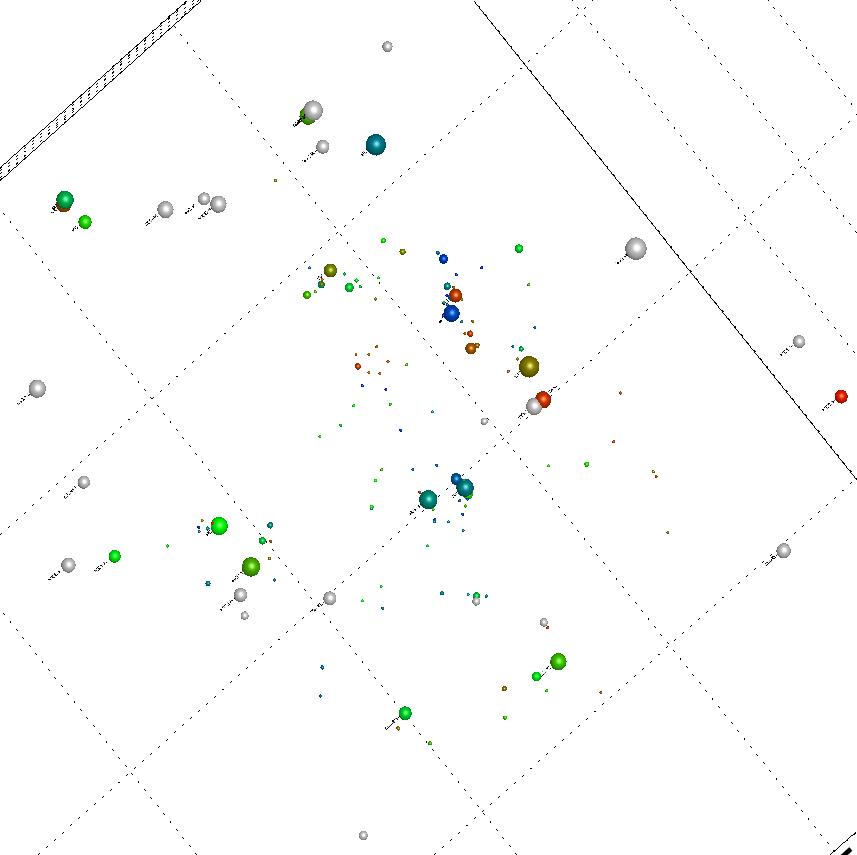
The plot itself shows each galaxy as a sphere. The size (volume) of the sphere is proportional to the luminosity. The color shows the peculiar radial velocity: if it's coming toward us relative to the overall expansion , it's colored blue, and the faster, the bluer; going away, it's colored red. Galaxies close to the average expansion rate are green. (The 21 galaxies with poorer data are gray, showing that I didn't think I could trust their peculiar radial velocities.) In the original display the last three dimensions, showing where each galaxy is in space, can be simulated interactively by rotating the data; here, I've just given two-dimensional projections.
|
|
|
Three views of the Local Volume: upper left, from above the Supergalactic Plane and about longitude 220 degrees; upper right, from inside the Plane and about longitude 270 degrees; left, from almost directly above the Plane. You can see the tendency to form groups of galaxies, and a concentration (especially at upper right) in the Plane. But be careful! Galaxies next to each other in any 2D projection may in fact be far away. The lines in the background box are 5 megaparsecs (Mpc) apart. |
What you see: It's pretty clear that galaxies are collected into groups, mostly; this isn't just because we've only looked for them in particular directions. The Local Group, the Sculptor Group, the M81/82 Group, Centaurus A and its companions, all show up clearly. Also, and probably more clearly in the 3D version, there is the Supergalactic Plane, a concentration of galaxies in a flattish shape in the middle of the Local Volume. In fact the Supergalactic Plane goes much farther out, past the Virgo Cluster and beyond, over dozens of megaparsecs (at least).
What you don't see is possibly more interesting. The rms peculiar radial velocity is about 75 kilometers per second, at which rate something will go about 1.3 Mpc in the age of the universe. That means that galaxies are, on the average, not far from where they've always been. More to the point, they haven't had time to mix around much, so they should still be in the process of forming the structures (groups and the Supergalactic Plane) that we see. So we should see infall into groups: red galaxies on the near side, blue on the far side. And we should see infall into the Supergalactic Plane: blue galaxies perpendicular to the Plane, red galaxies in the Plane, on the average. And we don't see either one.
Of the 75 km/sec, most of it is real motion; only a few km/s can be attributed to noise from observational errors. So something is causing galaxies in the Local Volume to depart from a smooth flow. But it doesn't seem to be the visible structures in the Volume.
Details may be found in the full paper.