

Reflection Grating Spectrometer
The X-ray CCD cameras on XMM used for imaging can also distinguish the energy of incoming X-ray photons. The spectral resolution of a CCD is only moderate and does not reveal the full complexity of many X-ray spectra. Therefore, XMM carries a different type of spectrometer, with much higher spectral resolution for very detailed studies in the 0.35 to 2.5 keV energy range, so-called "Reflection Grating Spectrometer" (RGS).
![]()
How an X-ray spectrum is formed?
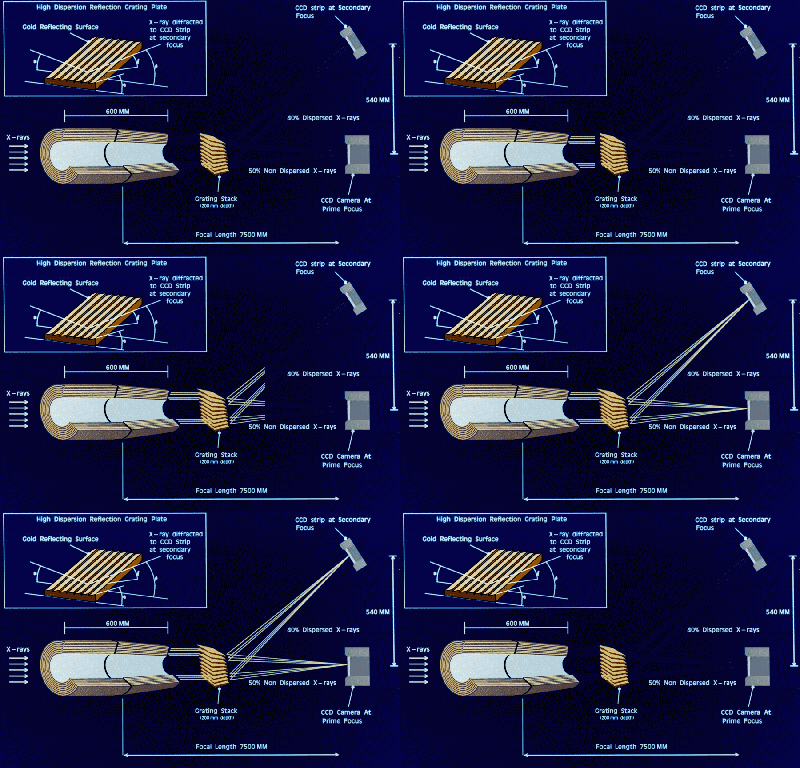
The reflection grating operates by reflecting a fraction of the received X-rays away from the main telescope axis by a small angle. The layout of the reflection grating and detectors on XMM is shown below.

Each grid of the grating will reflect a small amount of the received X-ray flux onto the CCD detector array. In total about 50% of the received signal is removed from the direct signal. The remaining signal continues to the focal plane where it is imaged by the EPIC instrument.
Each grid on the grating is extremely small, so from Huygen's Principle the reflected light looks like a line of point sources, each emitting secondary wavelets. The principle of superposition of waves shows us that the different wavelengths of light will have a maximum intensity at slightly different angles, thus the reflected light will show wavelength dispersion.
Also the curved shape of the grating causing the reflected light to be focused onto the large circle shown. This circle is known as the Rowland Circle. The advantage of this arrangement is that there is no need for any focusing elements behind the grating.
The resolution and angular dispersion of the grating can be calculated from the grating equation. It is expected that at 0.5keV, or 2.5nm, the RGS should be able to resolve features separated by 1.25eV or 6x10⁻³nm. This is worse than the grating equation would predict as the actual resolution s limited by the telescope spatial resolution.
The grating equation also predicts that the 1st to 3rd orders of the spectrum are overlapping, which is a consequence of the very short wavelength of light being observed. To distinguish between the individual spectra from each of the orders the course energy resolution of the CCDs is used.
To find out more about the Reflection Grating Spectrometer click here.
End of Waves and Diffraction topic.

