

![]() What is the inherent strength and stiffness of a material?
What is the inherent strength and stiffness of a material?
![]()
What we did with the spring we can also do with a sample of material. Let us make a cylindrical sample of the material and clamp the ends of it in the jaws of a machine that can either push or pull the material along its length, that is to say can apply either a longitudinal compressive or longitudinal tensile force between the ends of the sample.
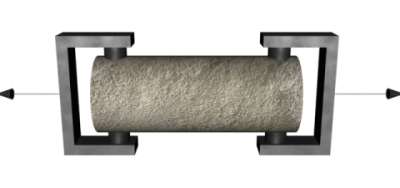
The values for the strength and stiffness of a material are very important for engineers. The above picture is a simplified view of how such experiments are carried out.
Please place you mouse pointer over the image ..
For the moment let us just consider tensile forces and measure how much the material is stretched as we increase the tension. Clearly the amount it stretches for a given tension will depend on the cross sectional area of the sample and also on its length. However, we can "normalise" our approach by considering the force per unit cross-sectional area and the extension per unit length. If we plot one against the other we get a curve which looks like
Interestingly the curve looks very similar to the upper right quadrant of the previous graph. Needless to say this is not a coincidence.
If we were to call our Y-axis the stress and the X-axis the strain this graph then represents the stress-strain curve of the material.
Just a few points.
The curve is linear up to the limit of proportionality (and is the same Hooke's Law as we had for the spring). This is equivalent to the linear portion of the curve o-n on the graph of dU/dr against r which was shown earlier. Beyond this point both curves go non-linear. However, up to the elastic limit the material will always return to its original dimensions when the tension is removed. Beyond the elastic limit some of the atoms in the array are sliding over their neighbours and forming bonds with new partners and this becomes progressively so as the tension is increased. At some point, the breaking point, some of the bonds are collectively broken such that the material parts. (The yield stress is that stress at the yield point and is the point at which the material exhibits plastic behaviour).
[During elastic deformation the total potential energy of the atoms is being increased both in compression and tension as we saw earlier in the U versus r graph. Hence in deformation, energy is stored in the material (just as a spring stores energy). The magnitude of the stored energy is ½ stress x strain. This is equivalent to the area of a triangle which is what we get by considering the area of the stress-strain curve under the linear part or, in other words, by integrating the function represented by Hooke's Law. For example, a stretched cable used to tow a crippled ship stores a great deal of energy and can be very dangerous if it parts.]
The strength of a material relates to the maximum force that can be applied to the material before it breaks. It is formally defined as the ultimate tensile strength and is the maximum stress that can be applied. It therefore has units of Pa
The stiffness relates to the resistance which a material offers to having its size and/or shape changed. In this sense it is the same as the spring constant or spring stiffness that we discussed earlier and is simply the slope of the linear portion of the stress/strain curve.
Formally the slope is known as Young's modulus (E) and is defined as
![]()
Because the strain is dimensionless, the units of Young's modulus are the same as for stress (Nm-2 ). Young's modulus is synonymous with stiffness.
The value of Young's modulus is therefore the stress that must be applied to double the length of any specimen ( i.e. extending it by an amount equivalent to its original length, or for the spacing between atoms to double). We could not actually do this with metals simply because the material would break before this happened.
As an example consider mild steel:
|
Young's modulus |
200 Gpa (2.0 x 10¹¹ N m-2) |
|
Ultimate tensile strength |
460 Mpa (2.0 x 10¹¹ N m-2) |
[note that Gpa is a giga pascal (109 pascals), and Mpa is a mega pascal (106 pascals)]
From these figures you can calculate what the percentage increase is in the spacing between the atoms when the steel fractures. For the solution click here.
To place these numbers in some context it is useful to note
|
0.1 MN m-2 |
= atmospheric pressure at ground level |
|
|
= water pressure at a depth of 10 m |
We see that the ultimate tensile strength is the inherent strength of the material rather than the result of any particular design. Here are some other typical values of ultimate tensile strength which you might find surprising
Cement/concrete/brick |
5 Mpa |
Tendon (living) |
80 |
Bone (living) |
110 |
Human hair |
190 |
Wrought iron |
200 |
Spider's silk |
240 |
Silk |
350 |
Aluminium alloys |
400 |
Mild steel |
450 |
Nylon thread |
1050 |
Titanium alloys |
1000 |
Carbon fibre |
1500 |
High tensile steel |
1550 |
Steel piano wire |
3100 |
However, there is another way in which we could have ordered these numbers.
Consider the situation where you have just sawn through a piece of wood of a cross section of 10 cm2 for example. In sawing the wood you have broken the bonds of as many atoms as are "exposed" in the 10 cm2. If you could pack more atoms into the 10 cm2 then the wood would be stronger.
Hence in general, the strength of the material is related to the density of its atoms. However, the more dense the material the more it weighs, and here there is a lesson to be learned. There is little point in building a working structure if its strength is required simply to support its own weight rather than any additional weight that you might care to put on it; it becomes a case of diminishing returns.
Value for money could therefore be described by strength per unit mass which we could obtain by taking the above numbers and dividing them by the density of the given material and then re-ordering the numbers. If we did that we could see how clever Mother Nature has been in developing the structures of living things. Why don't you do this exercise for yourself and see what you get?
If you look at real value for money by seeing what the strength is per unit density of the material, then Mother Nature does pretty well in these stakes.
Before we move on it is worthwhile just tidying up a few points.
First, we can see that, to first approximation, the inherent strength of materials is the same in compression as in tension. In practice however materials are stronger in tension than compression simply because it is difficult to apply a compressive force longitudinally along the axis of a sample without the material buckling (as we discussed in the case of compressing a spring).
Second, there are other ways in which we can try and change the shape of a substance besides longitudinally and these give rise to analogous definitions. For more click here. Forces can be applied in shear (i.e. at right angles to the specimen) and radially (to a spherical specimen).
In summary, if we return to our potential energy curve (U versus r) that we discussed earlier, we see that strength is really related to the depth of the minimum and stiffness is related to the slope either side of the minimum. Clearly they can be related in the sense that deep holes usually have steep sides, though not always so. Hence many strong materials are also stiff.